Car Price Analysis and Visualization
1 Project Overview
This project analyzes the average price of luxury car brands using Python, Pandas, and Plotly.
It provides insightful visualizations to compare car prices across different brands.
1.1 Key Features
- Vertical & horizontal bar charts for data comparison.
- Formatted tables with well-structured insights.
- Custom styling for better visual appeal.
- Number formatting to improve readability.
2 Example Visualizations
2.1 Formatted Data Table
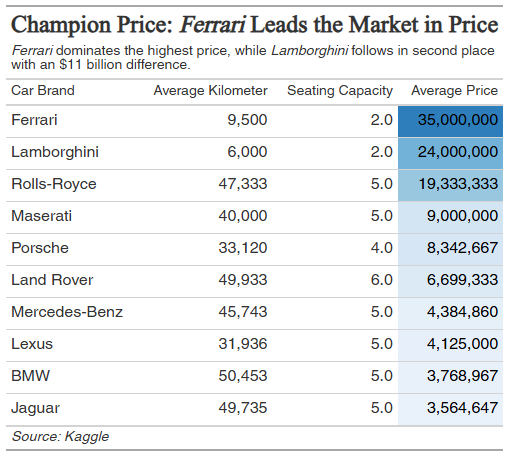
This table presents key specifications of luxury car brands, including their average price, mileage, and seating capacity.
The color-coded price column visually highlights the most expensive brands, reinforcing Ferrari and Lamborghini’s dominance.
Interestingly, the data also reveals that sports cars tend to have lower mileage, further suggesting that they are driven less compared to larger, more practical luxury vehicles.
2.2 Vertical Bar Chart
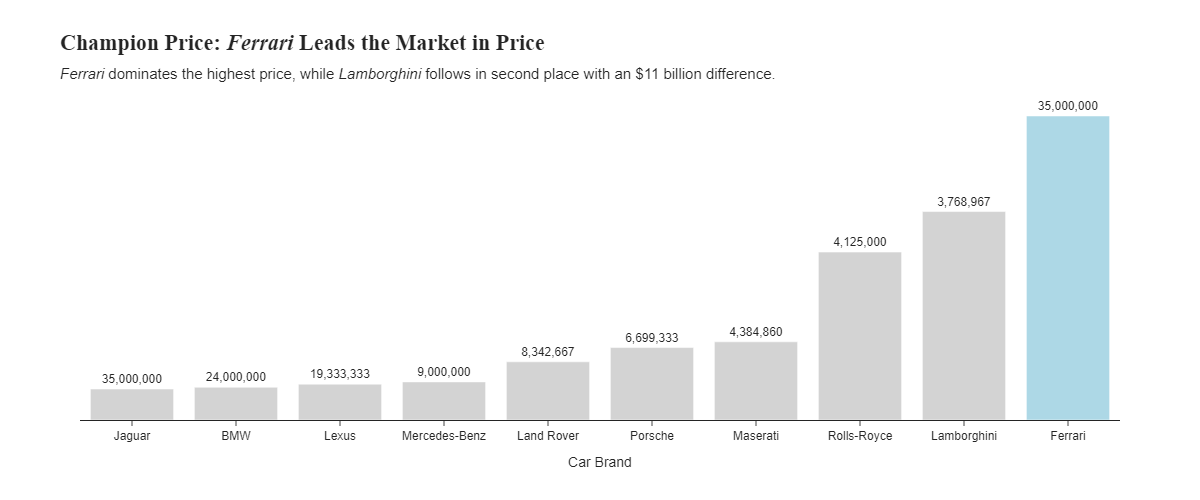
This vertical bar chart visualizes the ranking of car brands by average price, reinforcing Ferrari’s position as the most expensive brand, followed by Lamborghini and Rolls-Royce.
The labels provide precise price values, helping illustrate the steep differences among luxury brands.
This format effectively showcases the clear hierarchy in pricing within the high-end automobile market.
2.3 Horizontal Bar Chart
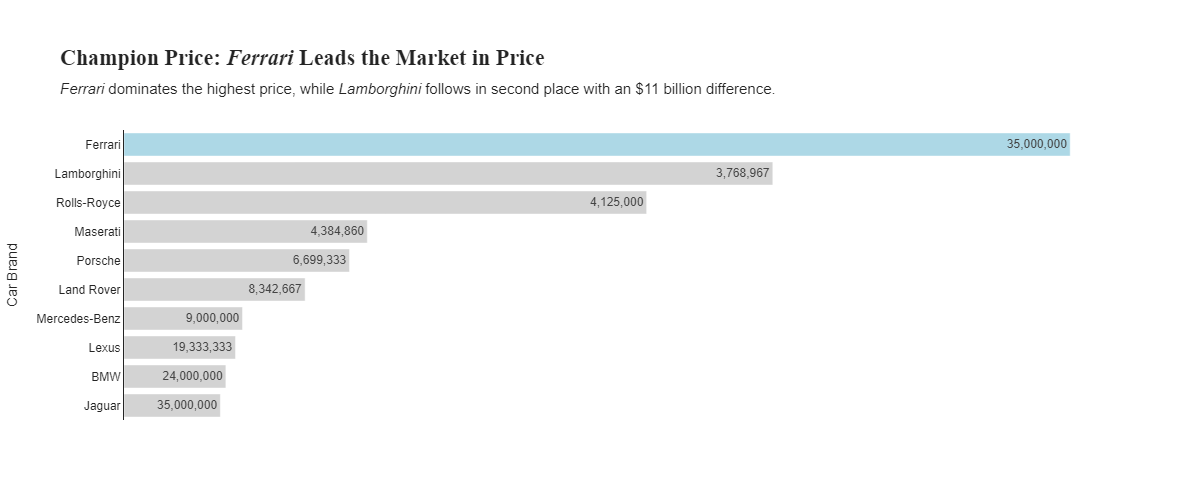
This horizontal bar chart highlights Ferrari as the most expensive car brand, with a significant price gap of $11 million above its closest competitor, Lamborghini.
Rolls-Royce, Maserati, and Porsche also rank among the higher-priced brands, while luxury SUVs such as Land Rover, Lexus, and BMW fall into a lower price range.
The chart emphasizes how brand reputation and performance contribute more to pricing than vehicle size or seating capacity.
2.4 Facet Bar Chart
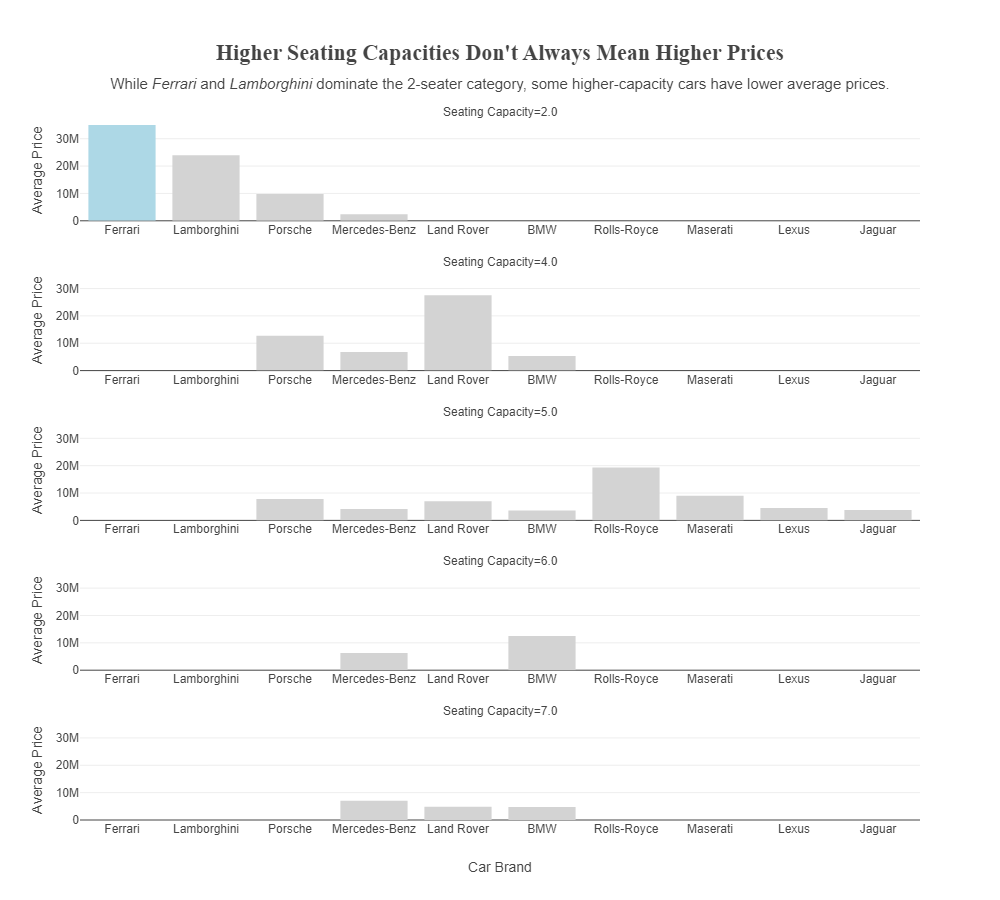
This chart segments car prices based on seating capacity, revealing that higher seating capacities do not necessarily lead to higher prices.
While 2-seater luxury brands like Ferrari and Lamborghini dominate in price, some 4- and 5-seaters—such as Rolls-Royce and Maserati—also command premium prices.
However, vehicles with 6-7 seats tend to have lower prices, indicating that exclusivity and performance may play a greater role in pricing than seating capacity.
3 Technologies Used
- Python (for analysis)
- Pandas (for data processing)
- Plotly (for interactive visualizations)
- Great Tables (for table formatting)
- Jupyter Notebook (for running the analysis)
4 Future Improvements
- Add interactive tooltips to the bar charts.
- Improve color schemes for better data visualization.
- Expand dataset to include more car brands and features.